


Chapter 18 Version 1 ColdFire Debug (CF1_DEBUG)
MCF51QE128 MCU Series Reference Manual, Rev. 3
414 Freescale Semiconductor
Get the latest version from freescale.com
# pst = 1c, 1c, 05, 0d
# ddata = 2a, 23, 28, 20
# trg_addr = 083a << 1
# trg_addr = 1074
_isr:
01074: 46fc 2700 mov.w &0x2700,%sr # pst = 01
01078: 2f08 mov.l %a0,-(%sp) # pst = 01
0107a: 2f00 mov.l %d0,-(%sp) # pst = 01
0107c: 302f 0008 mov.w (8,%sp),%d0 # pst = 01
01080: e488 lsr.l &2,%d0 # pst = 01
01082: 0280 0000 00ff andi.l &0xff,%d0 # pst = 01
01088: 207c 0080 1400 mov.l &int_count,%a0 # pst = 01
0108e: 52b0 0c00 addq.l &1,(0,%a0,%d0.l*4) # pst = 01
01092: 11c0 a021 mov.b %d0,IGCR0+1.w # pst = 01, 08
# ddata = 30, 30
# wdata.b = 0x00
01096: 1038 a020 mov.b IGCR0.w,%d0 # pst = 01, 08
# ddata = 28, 21
# rdata.b = 0x18
0109a: 4e71 nop # pst = 01
0109c: 71b8 ffe0 mvz.b SWIACK.w,%d0 # pst = 01, 08
# ddata = 20, 20
# rdata.b = 0x00
010a0: 0c80 0000 0041 cmpi.l %d0,&0x41 # pst = 01
010a6: 6f08 ble.b _isr_exit # pst = 05 (taken branch)
010b0: 201f mov.l (%sp)+,%d0 # pst = 01
010b2: 205f mov.l (%sp)+,%a0 # pst = 01
010b4: 4e73 rte # pst = 07, 03, 05, 0d
# ddata = 29, 21, 2a, 22
#trg_addr = 2a19 << 1
#trg_addr = 5432
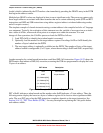
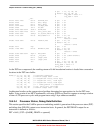
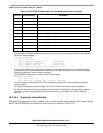
As the PSTs are compressed, the resulting stream of 6-bit hexadecimal entries is loaded into consecutive
locations in the PST trace buffer:
PSTB[*]= 1c, 1c, 05, 0d, // interrupt exception
2a, 23, 28, 20, // branch target addr = 1074
19, 08, 30, 30, // 9 sequential insts, write byte
01, 08, 28, 21, // 1 sequential inst, read byte
12, 08, 20, 20, // 2 sequential insts, read byte
01, 05, 12, // 1 + taken_branch + 2 sequential
07, 03, 05, 0d, // rte, entry into user mode
29, 21, 2a, 22 // branch target addr = 5432
Architectural studies on the compression algorithm determined an appropriate size for the PST trace
buffer. Using a suite of ten MCU benchmarks, a 64-entry PSTB was found to capture an average window
of time of 520 processor cycles with program trace using 2-byte addresses enabled.
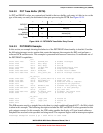
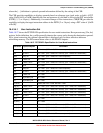
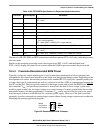
18.4.3.4 Processor Status, Debug Data Definition
This section specifies the ColdFire processor and debug module’s generation of the processor status (PST)
and debug data (DDATA) output on an instruction basis. In general, the PST/DDATA output for an
instruction is defined as follows:
PST = 0x01, {PST = [0x89B], DDATA = operand}