


Chapter 18 Version 1 ColdFire Debug (CF1_DEBUG)
MCF51QE128 MCU Series Reference Manual, Rev. 3
Freescale Semiconductor 409
Get the latest version from freescale.com
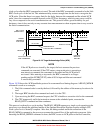
• ACK_DISABLE — Disables the ACK pulse protocol. In this case, the host should verify the state
of XCSR[CSTAT] in order to evaluate if there are pending commands and to check if the CPU’s
operating state has changed to or from active background mode via XCSR[31–30].
The default state of the protocol, after reset, is hardware handshake protocol disabled.
The commands that do not require CPU execution, or that have the status register included in the retrieved
bit stream, do not perform the hardware handshake protocol. Therefore, the target does not respond with
an ACK pulse for those commands even if the hardware protocol is enabled. Conversely, only commands
that require CPU execution and do not include the status byte perform the hardware handshake protocol.
See the “ACK if Enabled?” column in Table 18-25 for the complete enumeration of this function.
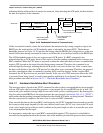
An exception is the ACK_ENABLE command, which does not require CPU execution but responds with
the ACK pulse. This feature can be used by the host to evaluate if the target supports the hardware
handshake protocol. If an ACK pulse is issued in response to this command, the host knows that the target
supports the hardware handshake protocol. If the target does not support the hardware handshake protocol
the ACK pulse is not issued. In this case, the ACK_ENABLE command is ignored by the target, since it
is not recognized as a valid command.
18.4.2 Real-Time Debug Support
The ColdFire family supports debugging real-time applications. For these types of embedded systems, the
processor must continue to operate during debug. The foundation of this area of debug support is that while
the processor cannot be halted to allow debugging, the system can generally tolerate the small intrusions
with minimal effect on real-time operation.
NOTE
The details regarding real-time debug support will be supplied at a later
time.
18.4.3 Real-Time Trace Support
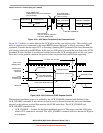
The classic ColdFire debug architecture supports real-time trace via the PST/DDATA output signals. For
this functionality, the following apply:
• One (or more) PST value is generated for each executed instruction
• Branch target instruction address information is displayed on all non-PC-relative change-of-flow
instructions, where the user selects a programmable number of bytes of target address
— Displayed information includes PST marker plus target instruction address as DDATA
— Captured address creates the appropriate number of DDATA entries, each with 4 bits of address
• Optional data trace capabilities are provided for accesses mapped to the slave peripheral bus
— Displayed information includes PST marker plus captured operand value as DDATA
— Captured operand creates the appropriate number of DDATA entries, each with 4 bits of data
The resulting PST/DDATA output stream, with the application program memory image, provides an
instruction-by-instruction dynamic trace of the execution path.