


276 Chapter 9 Forecasting
Forecasting tool
You use the Forecasting tool to create forecasts based on historical contact center traffic volumes. You can
then perform "what-if" scenarios, and optimize the balance between the agents scheduled and your Service
Level objectives.
To forecast resource requirements you
1. Load historical data.
2. Modify historical data if required.
3. Perform a forecast.
4. Print the forecast.
Loading historical data
When you load historical data, you include data over a historical period that best represents the call center
activity for the time period. You can select sequential or non-sequential dates (for example, Monday,
Wednesday, and Friday) to use in the forecast.
To load historical data
1. Click Tools=>Forecasting.
NOTE: You can load historical data for a queue or queue group. If you are using the forecast to build
a schedule, select historical data from the same queue group with which the schedule is associated.
This data will best represent the agents required for your schedule.
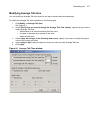
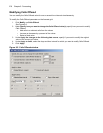
2. Click Load historical data.
The Forecasting window opens.
3. Under Queues or Queue groups, click on the queue or queue groups you want to use as the source
of historical data.
NOTE: You can select one or more specific dates and/or date ranges of historical data.
4. If you want to add a specific date, under Historical date(s) for the forecast, click Specific day.
• Select a date.
• Click Add dates.
• Repeat step 4 to add more dates.
5. If you want to add data from a date range, click Date range.
• After Every, select the date frequency.
• Select the check boxes for one or more days of the week.
• After From and To, select the start and end dates of the historical data period used for the
forecast.
• Click Add dates.
• Repeat step 5 to add more date ranges.
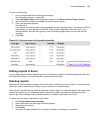
6. After Start hour and End hour, select the time frame for historical data.
The Interval value, in minutes, is the time increment by which the forecast will be displayed. For
example, if you schedule your employee shifts in 30 minute increments, select 30 minutes as the
Interval value.
7. After Interval, select the schedule interval: 15, 30, or 60 minutes.
8. Click Submit.
The forecast table is populated with historical data.
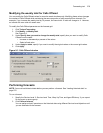
Modifying historical data
You must load historical data before you can modify it. After you perform a forecast and run "what-if"
scenarios, the changes you make to the historical data (for example, Calls Offered and Average Talk time)
affect the agents required.