


Contact Center Client 203
Viewing queue chart statistics
NOTE:
• You can see queue charts during business hours as long as the business schedule you configure in
YourSite=>Schedule is consistent with your company’s hours of operation. You assign a business-
hours schedule to your queues in YourSite=>Configuration=>Queue=>Queue.
The following charts display queue statistics:
• Queue Now
• Queue Group Now
• Queue Performance by Period
• Queue Group Performance by Period
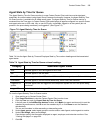
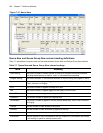
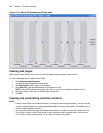
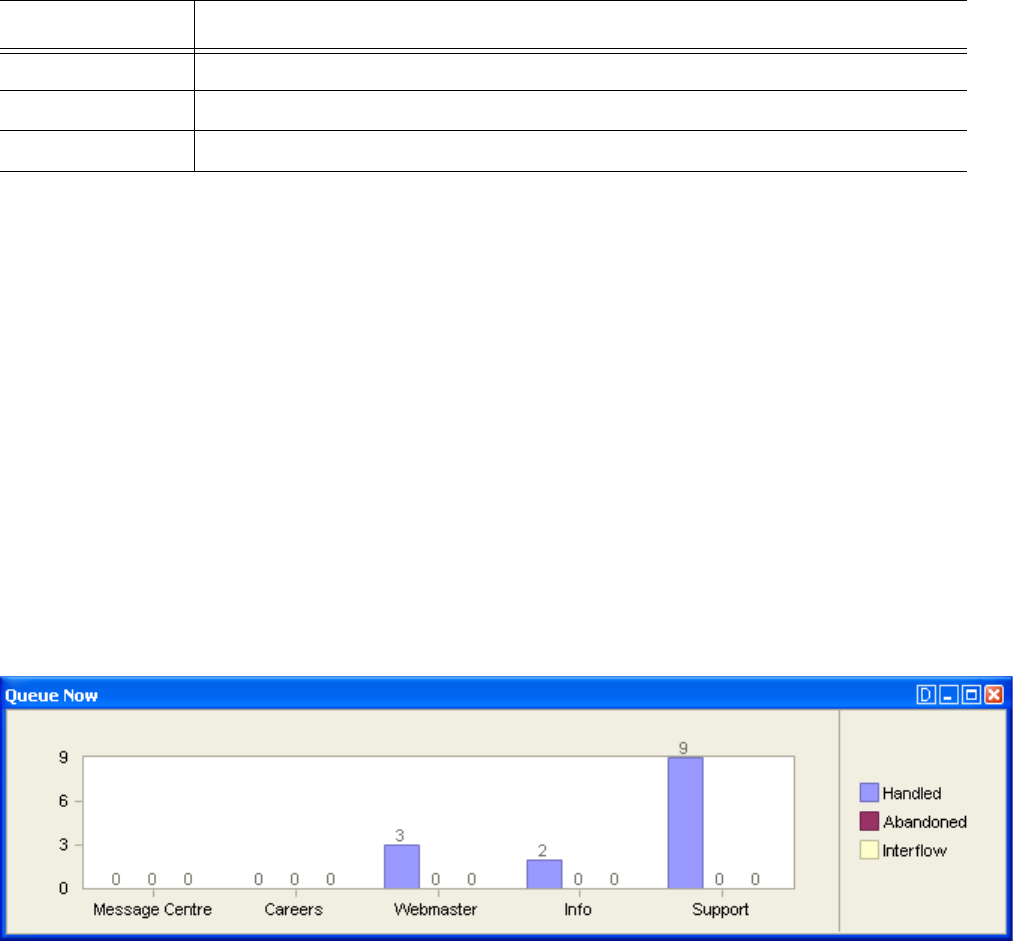
Queue Now and Queue Group Now
The Queue Now and Queue Group Now (Integer) charts show the total calls Handled, Abandoned, and
Interflowed across queues and queue groups for the day. (See Figure 7-13.)
Figure 7-13 Queue Now (Integer) chart
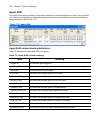
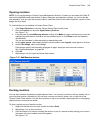
Queue Performance by Period and Queue Group Performance by Period
The Queue Performance by Period and Queue Group Performance by Period charts show the calls Handled,
Abandoned, and Interflowed across 15-minute intervals for queues and queue groups. (See Figure 7-14.)
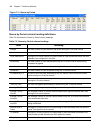
Wrap Up the total time the agent spent in the Work Timer state
Make Busy the total time the agent spent in the Make Busy state
Occupancy the total time the agent spent in an occupied state (occupied state excludes idle time)
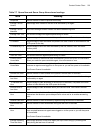
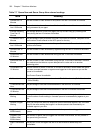
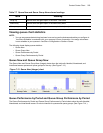
Table 7-7 Queue Now and Queue Group Now column headings
Term Meaning