


Mitel NuPoint Messenger Technical Documentation - Release 7.0
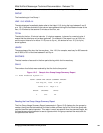
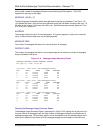
The first line of the report shows the date and time interval during which the data were gathered,
and the total number of messages that were received during that time period. This line is
repeated for each day of the report.
MESSAGE HOUR = 07
The data displayed immediately below was gathered during the hour between 7 and 8 a.m. 00-
14 indicates that data in that column were gathered during the first fifteen minutes of the hour; 15-
29 refers to the second 15-minutes of the hour, etc. Note how the report covers data from 7 to 8
a.m., 8 to 9 a.m., and so on.
AVERAGE
The average value of the four 15-minute samples. If a hyphen appears, in place of a numerical
value, it means that the data have not yet been gathered.
MESSAGE FREE
The number of messages that were not in use at the time of sampling.
PERCENT USED
The number of messages that were in use as percentage of the maximum number of messages
that are allowed on the server.
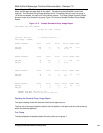
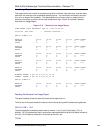
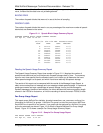
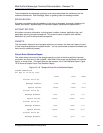
Figure 12-9 Message Usage Summary Report
AVERAGE MESSAGE USAGE SUMMARY REPORT
Fri Apr 21, 1995 10:50 am
04/14/95 13hr-16hr Max Messages=90000
DAY HOUR FREE USED PERCENT
1 13 86512 3488 4%
1 14 86518 3482 4%
1 15 86489 3511 4%
1 16 86472 3528 4%
04/14/95 13hr-16hr Max Messages=90000
DAY HOUR FREE USED PERCENT
2 13 86210 3790 4%
2 14 86189 3811 4%
2 15 86271 3729 4%
2 16 86227 3773 4%
04/14/95 13hr-16hr Max Messages=90000
DAY HOUR FREE USED PERCENT
3 13 86138 3862 4%
3 14 86096 3904 4%
3 15 86062 3938 4%
3 16 86015 3985 4%
Reading the Message Usage Summary Report
The Message Usage Summary Report ( see sample in Figure 12-9) displays the by day and hour,
the total number of messages used, the total number of messages available, and the percent of
message storage used. The summary report is much less specific than the standard report, but it
allows you to determine the hours at which message storage was at its peak, and which hours
©
Copyright 2002, Mitel Networks Corporation 166