Mitel NuPoint Messenger Technical Documentation - Release 7.0
Line Usage Report
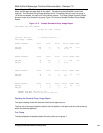
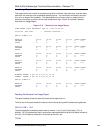
This report shows the number of seconds during which individual lines were busy, and how many
calls each line received, over a specified reporting period. You can display the data for a single
line, or for a range of line numbers. The reporting period can be any hour, or range of hours,
from the current day or portions of the most recent seven days. Figure 12-6 shows a Sample
Standard Line Usage Report.
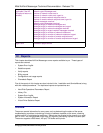
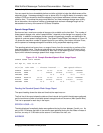
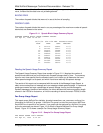
Figure 12-6 Standard Line Usage Report
LINE USAGE 15min REPORTFri Apr 21, 1995 10:28 am
04/21/95 8hr-12hr --- minutes interval ---
DAY=01 LINE=1:3:0
HOUR=08 00-14 15-29 30-44 45-59 TOTAL USAGE
SECONDS 0 0 0 0 0 0 %
CALLS 0 0 0 0 0
HOUR=09 00-14 15-29 30-44 45-59 TOTAL USAGE
SECONDS 0 0 0 0 0 0 %
CALLS 0 0 0 0 0
HOUR=10 00-14 15-29 30-44 45-59 TOTAL USAGE
SECONDS 0 0 0 0 0 0 %
CALLS 0 0 0 0 0
HOUR=11 00-14 15-29 30-44 45-59 TOTAL USAGE
SECONDS 0 0 0 0 0 0 %
CALLS 0 0 0 0 0
HOUR=12 00-14 15-29 30-44 45-59 TOTAL USAGE
SECONDS 0 0 0 0 0 0 %
CALLS 0 0 0 0 0
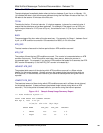
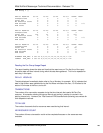
HIGHEST USAGE: 0 sec at 8,9,10,11,12 hr
LOWEST USAGE: 0 sec at 8,9,10,11,12 hr
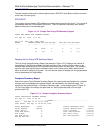
DAY=01 LINE=1:3:
HOUR=08 00-14 15-29 30-44 45-59 TOTAL USAGE
SECONDS 0 0 0 0 0 0 %
CALLS 0 0 0 0 0
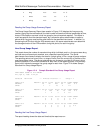
Reading the Standard Line Usage Report
The report heading shows the date and time that the report was run.
The first line of the report shows the date and time interval during which the data were gathered.
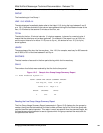
DAY=01 LINE = 1:3:0
The data displayed immediately below refer to module 1, slot 3, port 0 (the triplet 1:3:0), on
Monday. 00-14 indicates that data in that column were gathered during the first fifteen minutes of
the hour; 15-29 refers to the second 15-minutes of the hour, etc.
TOTAL
©
Copyright 2002, Mitel Networks Corporation 163


