


Mitel NuPoint Messenger Technical Documentation - Release 7.0
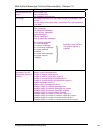
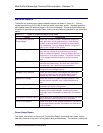
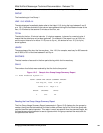
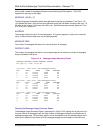
The first line of the report shows the date and time interval during which the data were gathered.
GROUP
The lines belong to Line Group 1.
LINE 1:0:3 HOUR=14
The data displayed immediately below refer to the triplet 1:0:3, during the hour between 2 and 3
p.m. 00-14 indicates that data in that column were gathered during the first fifteen minutes of the
hour; 15-29 refers to the second 15-minutes of the hour, etc.
TOTAL
The data for the four 15-minute intervals. If a hyphen appears, in place of a numerical value, it
means that the data have not yet been gathered. For example, if the report is run at 3:30 p.m.,
and the report interval is for hours 12-15 (noon to 3 p.m.), the entries for hour 15 (3 to 4 p.m.)
show hyphens.
USAGE
The percentage of the hour the line was busy. Line 1:0:0, for example, was busy for 300 seconds
out of 3600, or 8% of the time between 2 and 3 p.m.
SECONDS
The total number of seconds in the time period during which the line was busy.
CALLS
The number of calls that were received by that line for the time period.
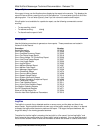
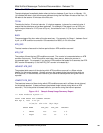
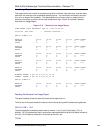
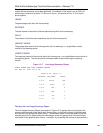
Figure 12-5 Sample Line Group Usage Summary Report
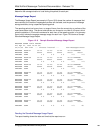
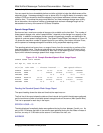
>>> Acme Products System <<<
TOTAL USAGE PER GROUP SUMMARY REPORT
Tue Aug 24, 1995 2:43 pm
Hours 8-17 Days 1-5
GROUP SECONDS CALLS
1 515 24
Reading the Line Group Usage Summary Report
The Line Group Usage Summary Report (see sample in Figure 12-5) displays the line groups by
number, then gives the total seconds, the total number of times, that a line in that line group was
used for the entire period reported. This report is much less specific than the standard report, but
it allows the server administrator to see at a glance which line group received the most traffic for
the specified time interval.
©
Copyright 2002, Mitel Networks Corporation 162