


Diagnostics and General Troubleshooting
7 - 3
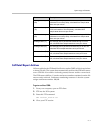
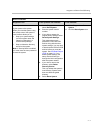
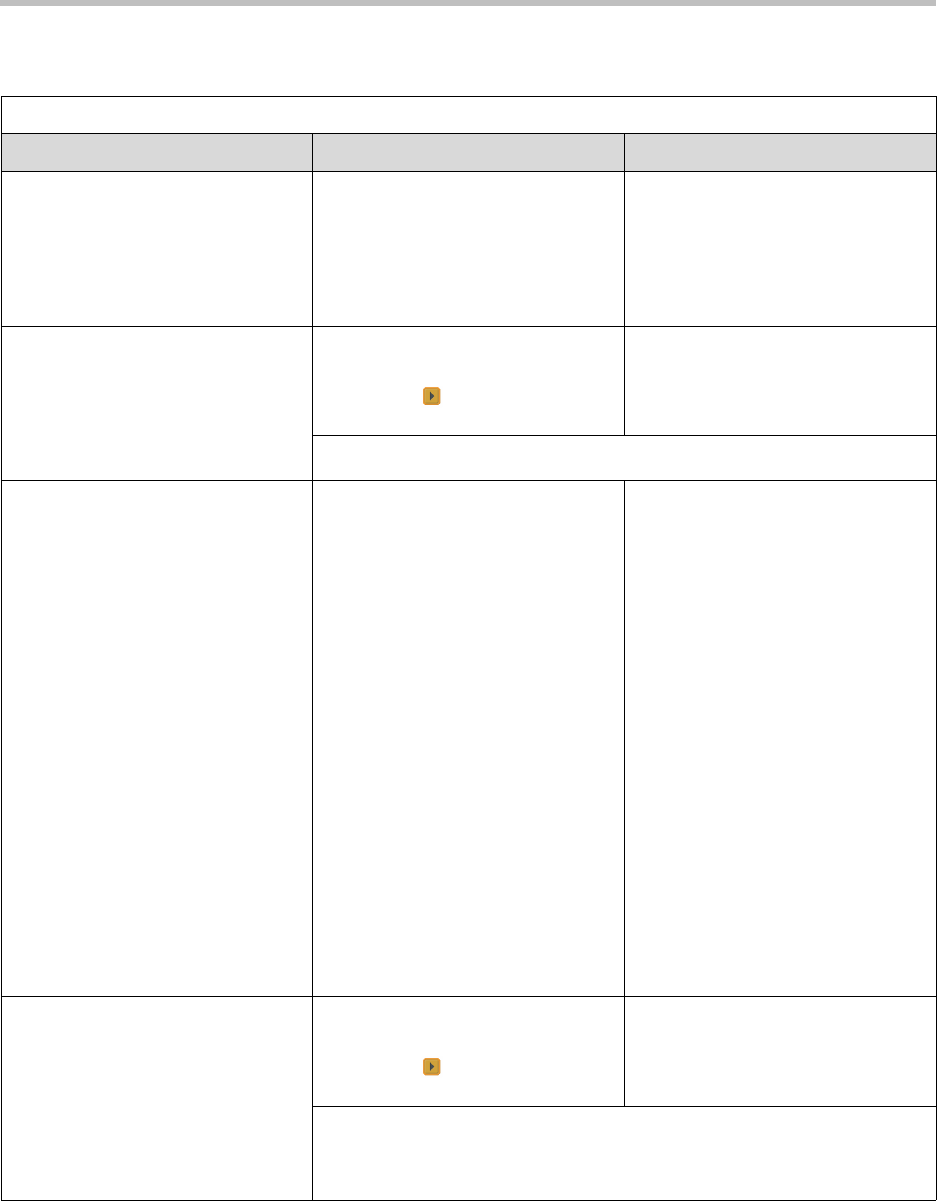
The following diagnostic screens and tools are available.
Status Tools
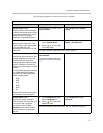
Diagnostic Tool In the system’s user interface In the VSX Web
System Status screen
Displays system status information,
including auto-answer point to point,
remote control battery, time server,
Global Directory, IP network,
gatekeeper, and ISDN BRI lines.
On the Diagnostics screen, select
System Status.
Select Diagnostics > System
Status.
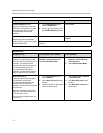
Call Summary screen
Displays calling information, such
as time spent in calls, total number
of IP and ISDN calls, and
percentage of time spent in IP and
ISDN calls.
1. On the Diagnostics screen,
select System Status.
2. Select to go to the Call
Summary screen.
Select Diagnostics > System
Status > Call Summary.
For more information about this screen, see on page 6-1.
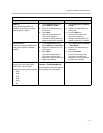
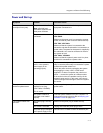
Call Status screen
Displays call type, data speed, and
number dialed for the current call.
In ISDN calls, this screen also
displays connection status for each
channel. Selecting a channel call
progress indicator displays its ISDN
number.
In VSX system calls placed through
a V.35/RS-449/RS-530 network
interface, this screen displays the
states of these signals:
• DTR
• RTS
• CTS
• DSR
• DCD
• RI
Bright indicators show high signals;
dim indicators show low signals.
On the Diagnostics screen, select
Call Statistics.
For more information about this
screen, see Call Status on page
6-3.
Not available.
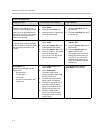
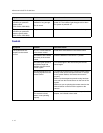
Call Statistics screen
Displays call speed, audio and
video protocols, annexes, and error
count for the call in progress.
In multipoint calls, the Call
Statistics screen shows most of
this information for all systems in
the call.
1. On the Diagnostics screen,
select Call Statistics.
2. Select to go to the Call
Statistics screen.
Select Diagnostics > Call
Statistics
.
For more information about this screen, see Call Statistics on page 6-2.