


Vmux-2100 Installation and Operation Manual Chapter 7 Monitoring and Statistics Collection
Collecting Statistics 7-17
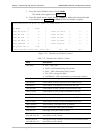
Displaying the E1/T1 Group Memory Statistics
Vmux-2100 estimates the number of free memory blocks (2000 bytes each) left in
the E1/T1 group RAM (see Figure 7-16):
• Start Blocks – Number of free memory blocks after the startup
• Current Blocks – Number of free memory blocks available at the moment
• Min. Blocks – Minimum number of free memory blocks ever registered by the
Vmux-2100 management software.
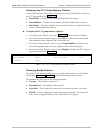
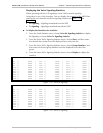
To display the E1/T1 group memory statistics:
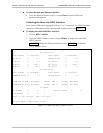
1. From the Cards Statistics menu (see Figure 7-11), choose Memory Statistics.
2. From the Memory Statistics menu, choose Slot> and then enter the desired
slot number from the displayed list to select the slot.
3. From the Memory Statistics menu, choose Group Number> and then enter
the desired group number from the displayed list to select the group.
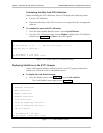
4. From the Memory Statistics menu, choose Display to display the E1/T1 group
memory statistics (see Figure 7-16).
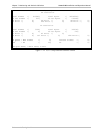
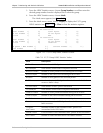
Memory Statistics on Slot 2, Group 1
Start blocks :[ 2663 ] Current blocks :[ 1817 ]
Min blocks :[ 1748 ]
Figure 7-16. E1/T1 Group Memory Statistics Screen
Displaying Bundle Statistics
The Vmux-2100 software enables you to evaluate performance of an individual
bundle (see Figure 7-17). Table 7-7 describes the bundle statistics values.
The bundles may have one of the following statuses:
• Connect – The bundle is connected
• Disconnected – The bundle is disconnected
• Echo Wait – There is physical connection, but remote bundle is not active.
• IP OOS – There is no physical connection between bundles. The reason for
that can be an illegal IP address of the destination E1/T1 group.