


Call usage rates
Issue 6 January 2008 183
Call usage rates
In the previous section, station usages and overall endpoint usages, including both stations and
trunks, were discussed. The overall endpoint usage is sometimes referred to as port usage rate
(PUR). The term station usage rate (SUR) applies when referring only to the stations. In
general, a traffic usage rate, when expressed in Erlangs, represents the average number of
busy servers in a given server group. So, SUR represents the average number of stations in a
particular group that are simultaneously in use, while PUR represents the average number of
endpoints, including stations and trunks, in a particular group that are simultaneously in use.
Similarly, the term call usage rate (CUR) represents the average number of simultaneous calls
that are carried by a particular facility. In an environment where essentially every call is either
inbound or outbound (such as a call center), CUR and SUR are equal, because there is exactly
one Communication Manager station used in each call. However, in an environment such as a
general business scenario in which some calls are intercom, some calls are inbound, and some
calls are outbound (such as a General Business scenario), CUR and SUR are not equal,
because some calls (the intercom calls) use two Communication Manager stations, and others
(inbound and outbound calls) use only one Communication Manager station.
The next step in the configuration process is to determine the amount of traffic flow between
Communication Manager systems in a network, and between the sites in each individual
Communication Manager system. Those traffic flows can be further refined to identify the traffic
flows between the various categories of endpoints within each site. All such traffic flows can be
represented in tabular form.
Communities of interest
The various sites within a particular Communication Manager system comprise communities of
interest (COI), in the sense that the endpoints in each particular site share some common trait
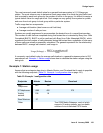
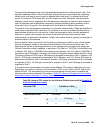
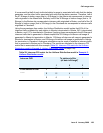
or interest, usually geographical proximity. A COI matrix offers a convenient representation of
the traffic flows between the various sites. For example, consider the COI matrix in
Table 25:
3-site standalone community of interest (COI) matrix on page 184 for a three-site,
stand-alone Communication Manager system.
In practice, a COI matrix that is associated with a given system is populated with actual traffic
values. In Table 25
, each diagonal matrix entry represents intrasite call usage, and all other
entries represent intersite call usage. The call usages used to populate the table can be
determined empirically or through theoretical means. In some cases, actual call usage data can
be obtained through polling an existing system. In other cases, it might be appropriate to apply
a mathematical model to estimate the call usages.