Chapter 20 Traffic Status
FMG3024-D10A / FMG3025-D10A Series User’s Guide
210
The following table describes the fields in this screen.
20.3 The LAN Status Screen
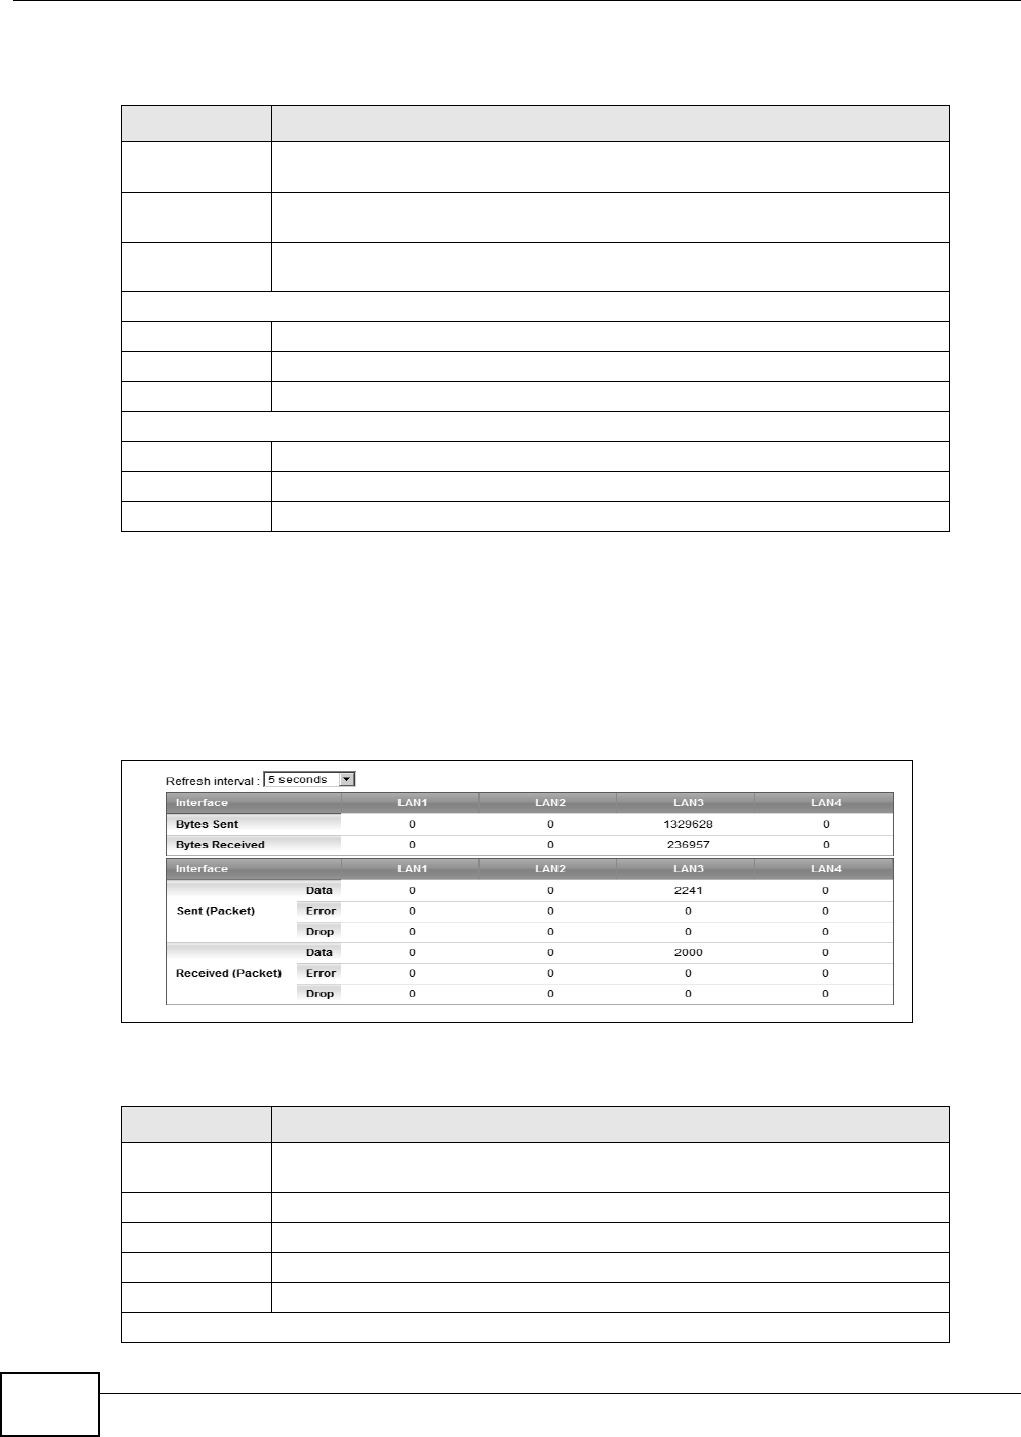
Click System Monitor > Traffic Status > LAN to open the following screen. You can view the LAN
traffic statistics in this screen.
Figure 107 System Monitor > Traffic Status > LAN
The following table describes the fields in this screen.
Table 70 System Monitor > Traffic Status > WAN
LABEL DESCRIPTION
Status This shows the number of bytes received and sent through the WAN interface of
the Device.
Refresh Interval Select how often you want the Device to update this screen from the drop-down
list box.
Connected
Interface
This shows the name of the WAN interface that is currently connected.
Packets Sent
Data This indicates the number of transmitted packets on this interface.
Error This indicates the number of frames with errors transmitted on this interface.
Drop This indicates the number of outgoing packets dropped on this interface.
Packets Received
Data This indicates the number of received packets on this interface.
Error This indicates the number of frames with errors received on this interface.
Drop This indicates the number of received packets dropped on this interface.
Table 71 System Monitor > Traffic Status > LAN
LABEL DESCRIPTION
Refresh Interval Select how often you want the Device to update this screen from the drop-down
list box.
Interface This shows the LAN interface.
Bytes Sent This indicates the number of bytes transmitted on this interface.
Bytes Received This indicates the number of bytes received on this interface.
Interface This shows the LAN interface.
Sent (Packet)
