View Status Options
36
7.4 View Trend Log
The Universal Monitor takes readings of configured analog input sen-
sors at regular intervals and stores them in four separate trend logs,
one for each sensor. The time interval is 30 minutes. Each log contains
up to 100 records.
Follow these steps to select a sensor and view its trend log:
7.4.1 Select a Sensor
To select a sensor:
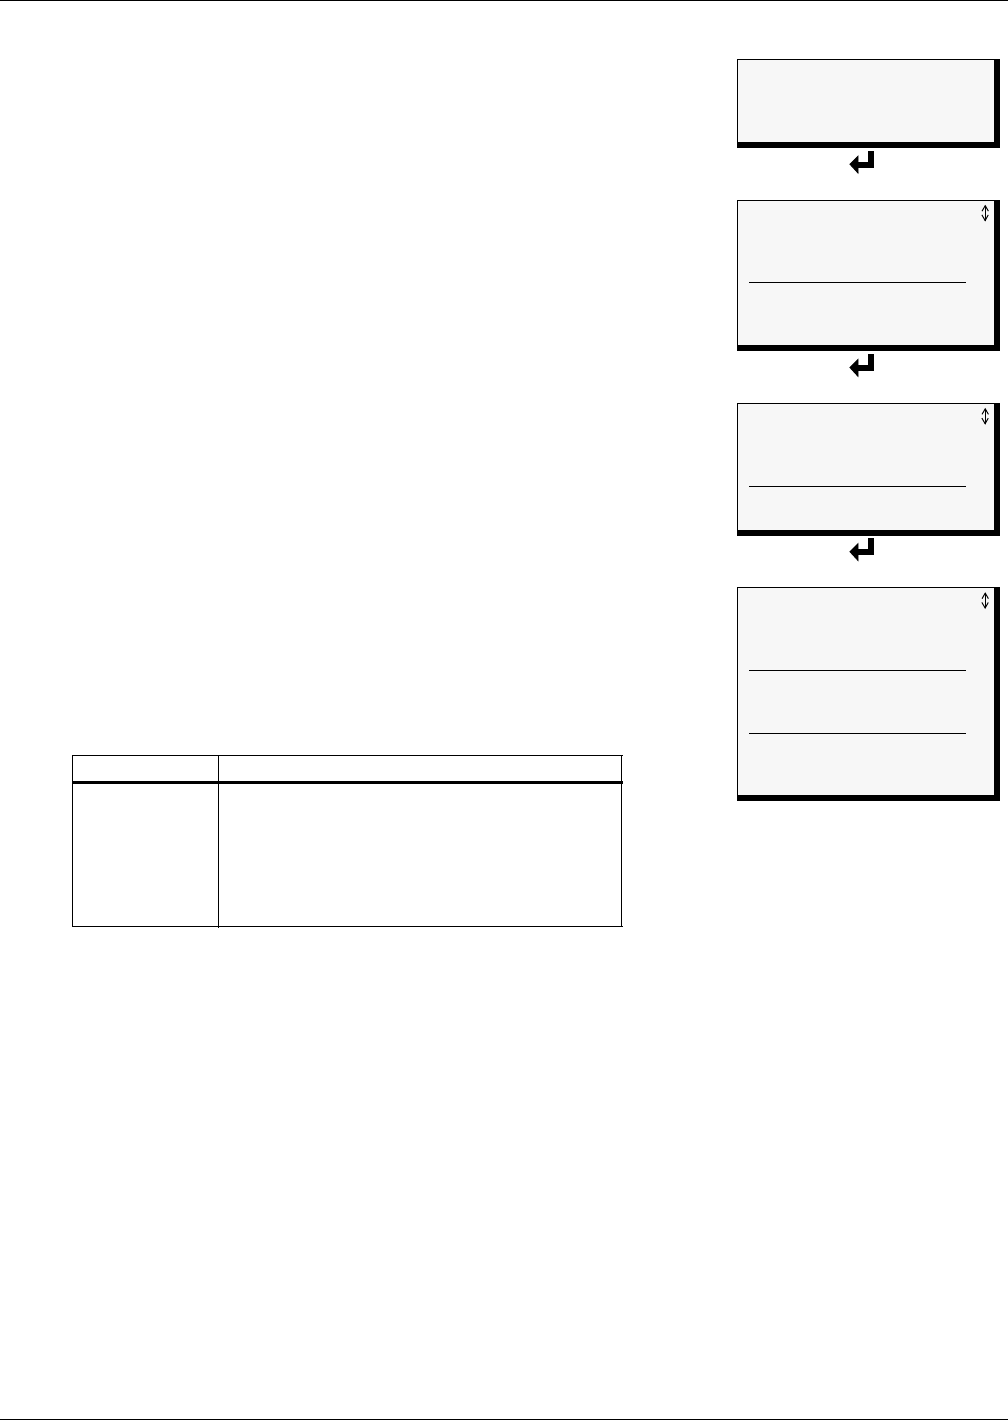
• From the Main Menu, use the arrows
↑↓ to choose View Status,
then press Enter ↵.
• From the View Status Menu, use the arrows
↑↓ to choose View
Trend Log, then press Enter ↵ .
• From the Sensor Selection Menu, use the arrows
↑↓ to choose the
sensor you want to view—Sensor_1 in the example at right—and
press Enter ↵ .
7.4.2 View a Trend Log
The Trend Log screen displays up to 100 records for the selected sensor.
If the log contains records, the screen displays details for each reading:
• the name of the selected sensor (for example,
SENSOR_1)
•the reading (
75.4 DEG)
• a brief description of the reading status (
NORMAL)
• the date and time of the reading
Table 16 shows conditions that the trend log records for analog inputs.
Each analog input has its own trend log.
If there are no records in the log, the screen displays the message:
NO TRENDS
Viewing Additional Screens
There may be up to 100 records of trend data for the selected sensor.
• To view additional records, use the arrows
↑↓.
• To return to the previous screen, press the ESC key.
7.4.3 Backing Up the Trend Log (Service Terminal Interface only)
The four trend logs are stored as files in the Universal Monitor, with a maximum of 100 records per
sensor. When a log is full, the oldest records are deleted from the end of the file as new trend records
are added at the beginning.
You may back up each trend log file to a remote computer using the Service Terminal Interface, as
described in 8.2 - Back Up Log Files (Service Terminal Interface only).
To delete all records in the trend logs, see 9.12 - Clear Alarms & Logs.
Table 16 Trend log conditions
SOURCE Analog Input
CONDITIONS
RECORDED
LOW SETPOINT ALARM
LOW SETPOINT EVENT
HIGH SETPOINT ALARM
HIGH SETPOINT EVENT
RETURN TO NORMAL
NORMAL
SENSOR PROBLEM (denoted by dashes ------)
Main Menu
> VIEW STATUS
SYSTEM AND CONTROL
↑↓=NEXT
↵ =SELECT
View Status Menu
VIEW ACTIVE ALARMS
VIEW ALARM LOG
VIEW EVENT LOG
> VIEW TREND LOG
VIEW INPUT STATUS
VIEW OUTPUT STATUS
VIEW PAGER NUMBERS
Select Sensor Menu
SENSOR TO VIEW?
> SENSOR_1
SENSOR_2
↑↓=NEXT ↵ =SELECT
SENSOR_3
SENSOR_4
Trend Log
> TREND LOG 100/100
SENSOR_1 75.4 DEG
NORMAL
28-AUG-02 15:45:51
SENSOR_1 70.5 DEG
LOW SETPOINT EVENT
28-AUG-02 15:15:51
SENSOR_1 79.9 DEG
RETURN TO NORMAL
28-AUG-02 14:45:21
