


MONITORING PERFORMANCE TRENDS LBI-39169
47
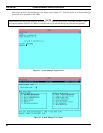
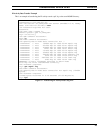
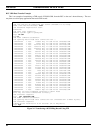
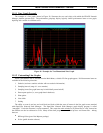
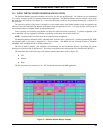
11.1.1 Line Graph Example
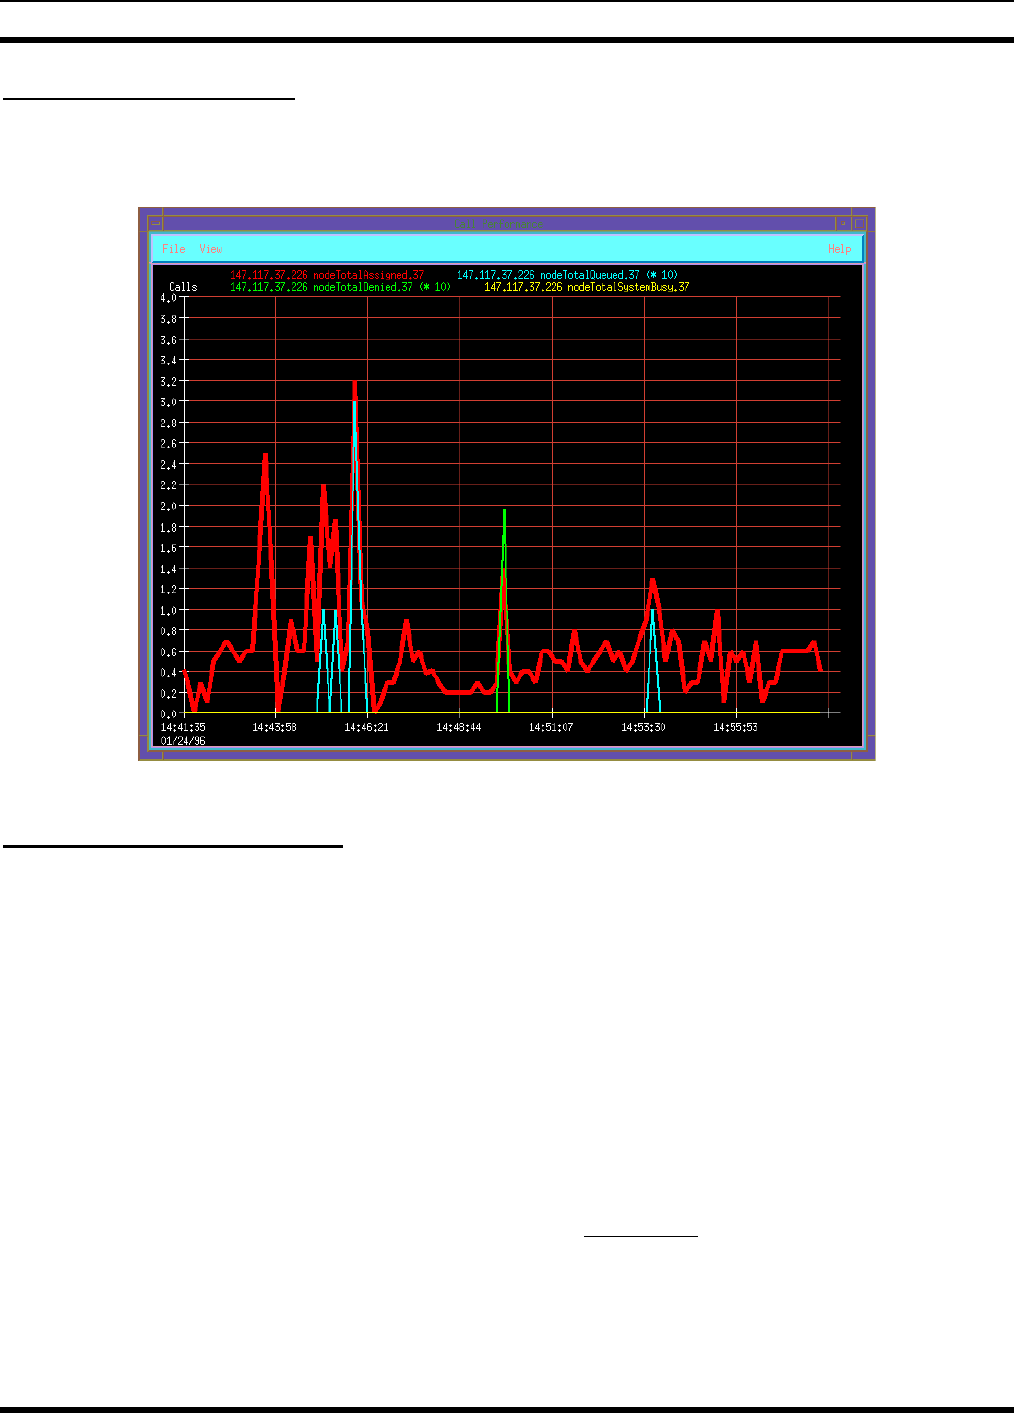
The example of a line graph, shown in Figure 26, illustrates the ease and clarity with which the EDACS Network
Manager platform presents data. The performance groupings display logically similar performance items on one graph,
depicting each variable in a different color.
Figure 26 - Example of a Two-Dimensional Line Graph
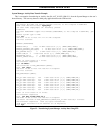
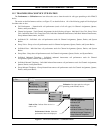
11.1.2 Customizing Line Graphs
When a performance item is selected from the Main Menu, a default 2-D line graph appears. Pull-down menu items are
available for the following selections:
1. Statistics (activate a statistics window with raw statistics information).
2. Sampling interval (range is 1 sec to months).
3. Sampling items (line graph items may be individually turned on/off).
4. Data capture option (i.e., store graph data in database).
5. Print option.
6. Line width.
7. Scaling
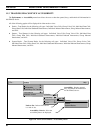
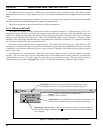
The ability to zoom in and out, and scroll back and forth, within the areas of interest in the line graph comes standard
with OpenView Network Node Manager. The OpenView Network Node Manager graph display program is called
“xnmgraph.” Under the file menu is a print command. This causes the entire window to be printed out in “xwd” format, but
the window can also be redirected to a file. Many off-the-shelf programs can read and process xwd format files. Among
these are
•
HP ImageView (part of the Mpower package)
•
Xview (public domain software)