


LBI-39169 MONITORING EDACS FAULT CONDITIONS
32
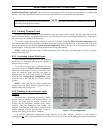
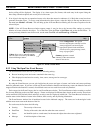
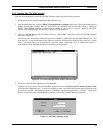
device polling will be displayed. The display is in a short report (list) format, with each entry in the report listing the
time stamp, alarm description, and severity level of the event.
5. If an object in the map has an operational status color other than normal or unknown, it is likely that events have been
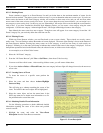
generated from that object. To access event information for these objects, select the object in the map and then access
the menu item Monitor -> Events. This will bring up the All Events Browser filtering out all events except those for the
selected object.
NOTE: If the All Events Browser window appears empty, it may be due to the incorrect filter settings or previous
deletion of events related to the object. To set the filter, open the View -> Set Filters and set the desired filters. To
access previously deleted events for the node, use the menu item File -> Load Event Log -> Filtered.
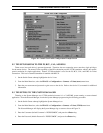
8.3.2 Using The OpenView Event Browser
The Event Browser allows the user to perform the following activity:
•
Browse incoming events and events contained in the events log.
•
Filter displayed events based on severity, time, source, message and or event type.
•
Get event help.
By using the Event Browser you can gain insight into the source and types of events, and isolate and correct problems
that have generated events. If you have a read-only Event Notification Interface and delete any events, the deleted events will
reappear next time the Interface is started, since deleted events are not saved from a read-only Interface.
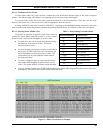
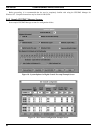
Each category in the Event Category has its own Event Browser window. The Event Browser window contains a scrolled
list of events belonging to the associated category. Events are displayed in different fonts, based on their severity These fonts
can be modified, but by default critical and major severity events are displayed in bold font. The Event Browser window also
contains status on the number of events in the window, their severity, and any filtering information.
The Event Browser window lists all undeleted events for the indicated category. The events are in chronological order
with the most recent event at the bottom of the list.
For each event, the list shows the following.
•
Severity The severity of the event.
•
Date/Time The day of the week, date and time when the event occurred.
•
Source An identifier (such as a node name) for the network object where the event originated.
•
Message A brief description of the event.
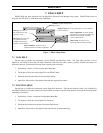
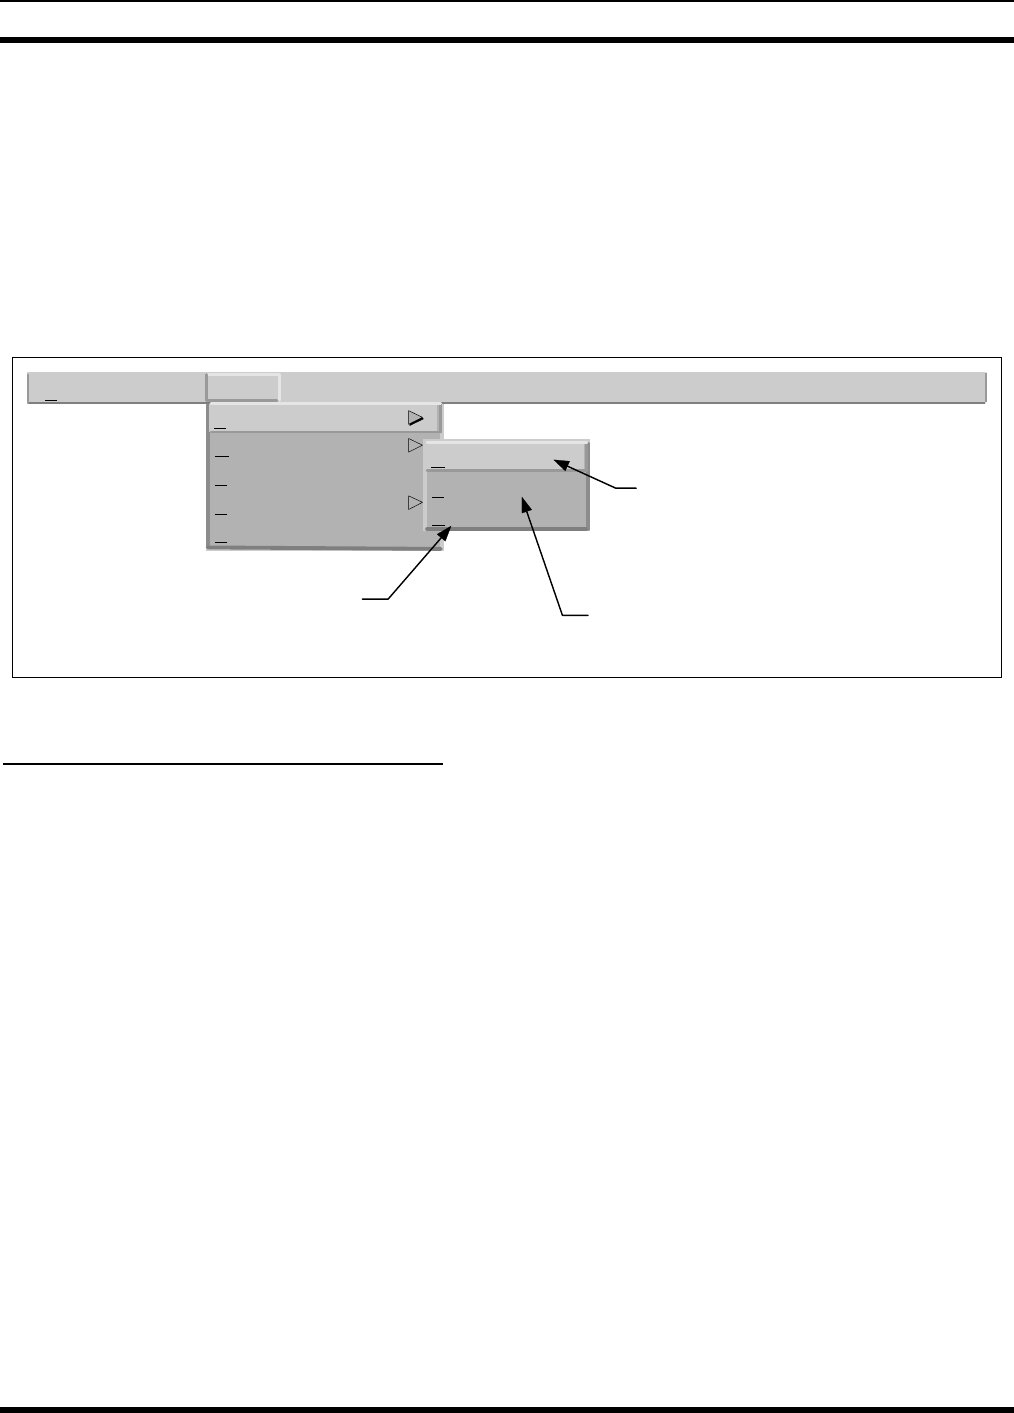
File...
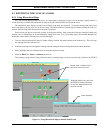
Faults
C
onfiguration
A
ccounting: File Transfer
P
erformance
S
oftware Version
EDACS
Hel
p
Faults
Configuration
S
ummary
U
pdate
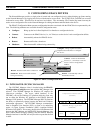
Configuration
Event
Configuration
. This option
involves adjusting the criticality level for
alarm propagation, and choosing the
appropriate optional fault notification
actions (such as, popup message, email,
beep, or pager option.
Summary
presents a textual
summary of the current alarm
status for this device.
Update
allows user to manually update
all icons status as known by the EDACS
Network Manager Station.
Figure 11 - EDACS Fault Menu