LBI-39169 MONITORING EDACS FAULT CONDITIONS
26
8. MONITORING EDACS FAULT CONDITIONS
Fault Management is responsible for detecting, isolating, and reporting alarm or fault conditions affecting the various
Managed Elements (ME) in the EDACS network.
8.1 DETECTING AND ISOLATING FAULTS (ALARMS)
Fault (alarm) or event status notification results from the Network Manager either receiving information from the EDACS
platforms or as a response to polling. When an event is received the user is notified of the event through the Event
Notification Interface or by changing the color of the appropriate icon on the hierarchical maps.
EDACS Fault Management tracks five user-configurable severity levels for each managed EDACS Network Element:
•
Normal
An application sets the status to “normal” when the object is in a normal operational state.
•
Warning
An application sets the status to “warning” when an object may face a potential problem.
•
Minor
An application sets the status to “minor/marginal” when an object has a minor problem; this
status should not, however, impede the normal use of the device.
•
Major
An application sets the status to “major” when an object has serious problems; these problems are
likely to impede normal use of the device.
•
Critical
An application sets the status to “critical” when a device is not functioning or is not accessible by
the EDACS Network Manager.
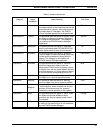
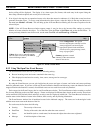
Table 1 lists the severity levels, descriptions, and associated colors. The severity levels and colors are configured
according to HP OpenView Network Node Manager conventions. Each alarm received is tracked internally. The color of the
icon does not change until all alarms received at that severity level have cleared, or an alarm at a higher severity level is
received. For the EDACS Network Manager application, green icons indicate there are no known managed faults against the
device represented by the icon.
Fault Management can periodically poll remote elements for missed traps. Elements on unlicensed nodes or sites will
have Restricted status, and any corresponding traps will be ignored. Refer to FCAPS section in LBI-39215 for the actual fault
items and Table 1 for the meaning of icon colors. The meaning of icon colors may also be obtained by selecting the Help ->
Display Legend from the main menu.
8.1.1 Notification through the Event Notification Interface
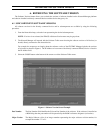
Once an alarm is generated, it is logged into the Event Logs. After the event is logged, the alarm specifics are available
through the Event Notification Interface. The Event Notification Interface includes the Event Categories window and the
multiple Event Browser windows.
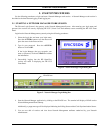
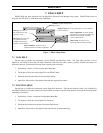
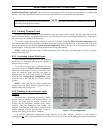
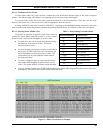
The Event Categories Window acts as an event notification window. The push
buttons in this window light up to indicate when events have been received and have
not been deleted from the Events Browser. The color of the push button reflects the
most severe event in the category, or background color if no events are present. The
“All Events” category contains all the events which are present in the other
categories. The “EDACS Events” category is added by the Network Manager
application software.
8.1.2 Notification Through Icon Color
After the Network Manager logs the event, it will change the appropriate map
icon(s) color if necessary, and if enabled, display a popup window reporting the
event and its severity.
Figure 8 - Event Category Window


