MONITORING EDACS FAULT CONDITIONS LBI-39169
31
8.3 IDENTIFYING THE CAUSE OF ALARMS
8.3.1 Using Hierarchical Maps
After the Network Manager alerts the user to an alarm either by changing an icons color or through a popup window, it
will be necessary to identify the responsible element causing the fault indication and isolate the cause.
The hierarchical maps display a greater level of detail as the maps are traversed. To prevent missing fault status, fault
colors propagate to the top level icon on the root map. The easiest method of identifying the element causing the fault is to
traverse down the maps until the element in question is displayed.
Events can be one shot or possess the concept of setting and clearing. Only events possessing the concept of setting and
clearing, such as linkup/down or board fail/normal, change icon color. For a given map object, the Network Manager can
display the current alarms affecting icon color for that object.
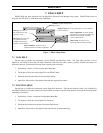
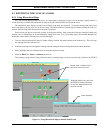
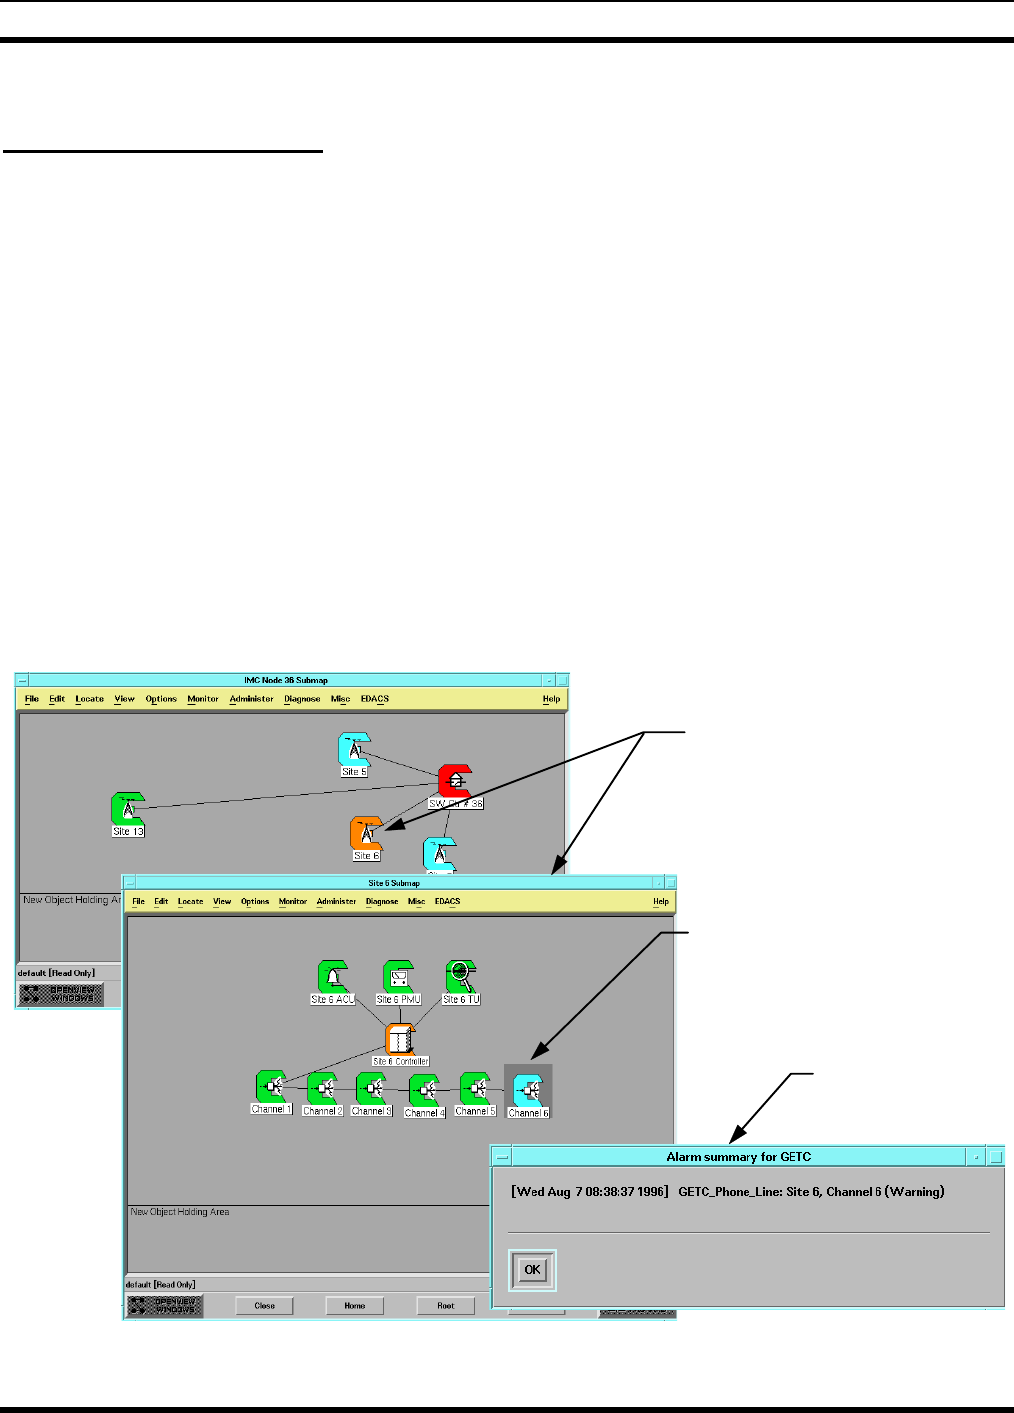
1. Traverse down the hierarchical maps by double-clicking with the left mouse button on the faulted icon. This will open
any submap associated with the icon.
2. Continue traversing down through the submaps until the managed element causing the alarm has been identified.
3. Select (highlight) the icon with the fault color using the left mouse button.
4. Select the
EDACS -> Faults -> Summary
menu item.
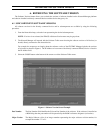
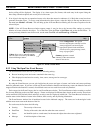
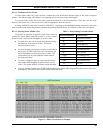
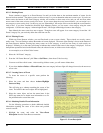
The summary popup window listing all known actively managed faults received asychronously or detected by EDACS
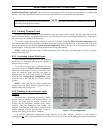
Figure 10 - Using Hierarchical Maps to Identify Fault Events
Double click on faulted icon to
traverse to next lower level.
Highlight faulted icon, and select
the EDACS->Faults->Summary
to view the Alarm Summary for
the icon selected.
Alarm Summary


