


76 GPSMAP 700 Series Owner’s Manual
Sonar
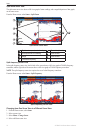
Showing and Conguring the Whiteline
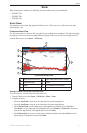
You can highlight the strongest signal from the bottom to help dene the hardness or softness of the signal.
1. From the Home screen, select > > .
2. Complete an action:
• Select to turn on the whiteline with the most-sensitive setting. Almost all strong returns are
highlighted in white.
• Select to turn on the whiteline with many strong returns highlighted in white.
• Select to turn on the whiteline with the least-sensitive setting. Only the strongest returns are
highlighted in white.
Setting the Color Scheme
1. From the Home screen, select > .
2. Complete an action:
• Select > .
• Select > .
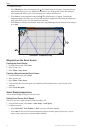
Adjusting the Gain on the Sonar Screen
You can control the sensitivity of the sonar receiver. To see more detail, increase the gain. If the screen is
cluttered, decrease the gain.
1. From the Home screen, select .
2. Select a sonar view.
3. Select > .
4. Complete an action:
• Select to allow the chartplotter to adjust the gain automatically.
• Select or to increase or decrease the gain manually.
5. Select .
Adjusting the Noise Rejection on the Sonar Screen
The Noise Rejection setting appears only when you have manually increased or decreased the gain setting
(page 76).
You can minimize the appearance of weak sonar returns by increasing the noise rejection.
1. From the Home screen, select .
2. Select a sonar view.
3. Select > .
4. Select or.
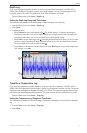
Selecting Frequencies
You can indicate which frequencies appear on the sonar screen when using a dual frequency transducer.
You can show data from a 200 kHz sonar signal, data from a 50 kHz sonar signal, or data from both signals
simultaneously.
1. From the Home screen, select .
2. Select a sonar view.
3. Select > .
4. Complete an action:
• Select to show data from a 200 kHz sonar signal. This is useful mainly for more-shallow,
inland waters.
• Select to show data from a 50 kHz sonar signal. This is useful mainly for deeper waters.
• Select to show both 200 kHz and 50 kHz data on a split screen.