


GPSMAP 700 Series Owner’s Manual 19
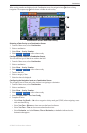
Charts and 3D Chart Views
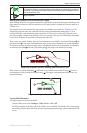
Showing a Sonar Cone on the Chart
You can show a cone that indicates the area covered by your transducer.
From the Home screen, select > > > > .
Showing Suspended Targets
From the Home screen, select > > > > .
Showing Tracks
From the Home screen, select > > > > .
Showing Overlay Numbers
See “Overlay Numbers” (page 48).
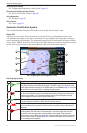
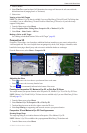
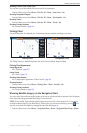
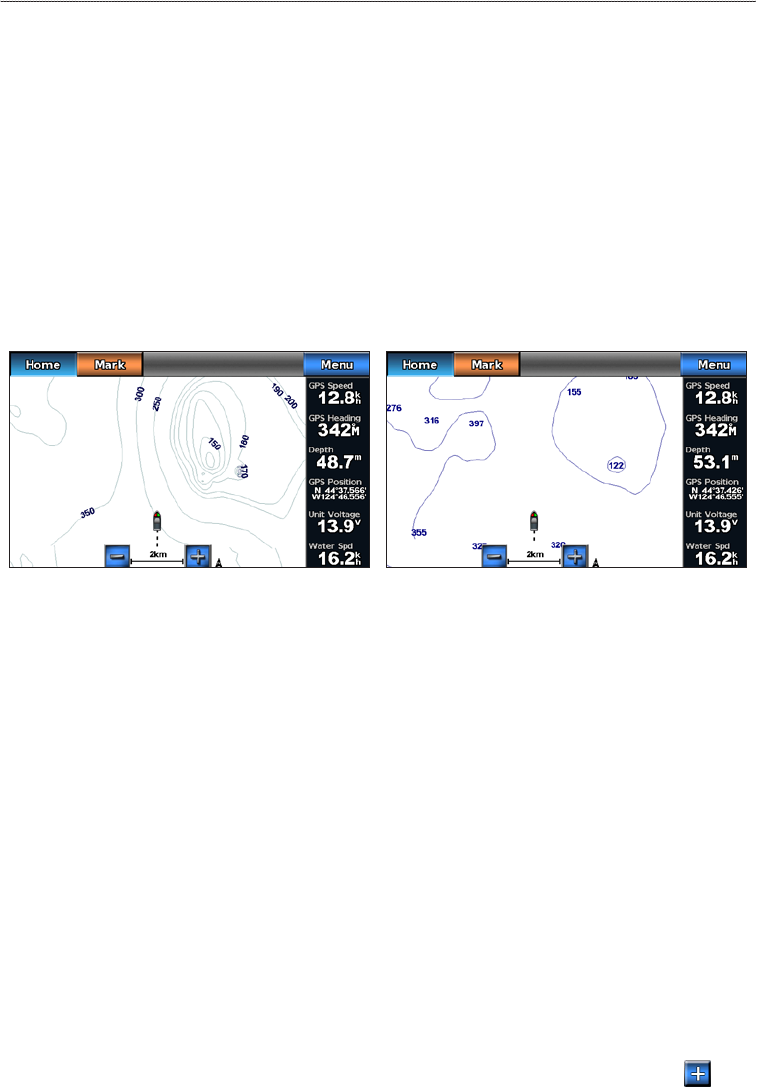
Fishing Chart
Use the Fishing chart for a detailed view of the bottom contours and depth soundings on the chart.
Navigation ChartFishing Chart
The Fishing chart uses detailed bathymetric data, and is best for offshore deep-sea shing.
Fishing Chart Appearance
Using Waypoints
See “Waypoints” (page 26).
Using Tracks
See “Tracks” (page 30).
Showing Other Vessels
See “Conguring the Appearance of Other Vessels” (page 50).
Showing Navaids
From the Home screen, select > > > > .
Showing Overlay Numbers
See “Overlay Numbers” (page 48).
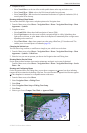
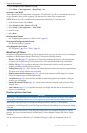
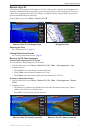
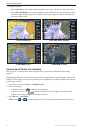
Showing Satellite Imagery on the Navigation Chart
You can overlay high-resolution satellite images on the land or on both land and sea portions of the Navigation
chart when using a preprogrammed BlueChart g2 Vision data card.
: When enabled, high-resolution satellite images are present only at lower zoom levels. If you cannot
see high-resolution images in your BlueChart g2 Vision region, you can zoom in further by pressing . You
also can set the detail level higher by changing the map zoom detail (page 8).
1. From the Home screen, select > > > > .