


52 Chapter 4 Nortel Networks i2050 Diagnostic Utility
P0988431 Issue 03
Accessing additional information
To access additional information about the i2050 Diagnostic Utility:
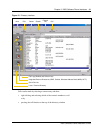
1 On the Help menu, click About.
The About window appears.
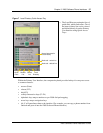
The About window displays information about the i2050 Diagnostic Utility, such as the version
number. From this window, you can also access two Microsoft Windows diagnostic utilities by
clicking the buttons on the window. These buttons are described in the following table.
Exiting the i2050 Diagnostic Utility
To exit from the i2050 Diagnostic Utility:
1 On the File menu, click Exit.
Table 10 Microsoft Windows Utilities
Button Description
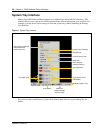
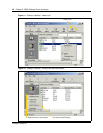
System Info Click this button to launch the Microsoft Windows System Information utility. The
Microsoft Windows System Information utility is a troubleshooting utility that provides
computer information including:
• System Summary (Operating System type and build, processor, memory, etc.)
• Hardware Resources
• Components (including USB where the USB audio device appears if it is enumerated
properly by the Operating System)
• Software Environment
• Internet Explorer information
• Microsoft Applications
You can save this information to a file that you can email back to the support group.
The Tools menu item within System Information utility also provides access to other
Microsoft trouble shooting utilities.
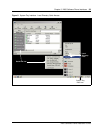
Utilities Click this button to open a window with a server address of the current (or last) Terminal
Proxy Server (TPS) address. From this window you can change the TPS IP address.
This window also has buttons to ping and trace route the TPS IP address. The number of
echoes the pings performs is controlled by the "Ping Count" field. The "Use DNS" field
controls whether the ping and trace route resolve addresses to hostnames using DNS
(this may cause the ping and trace route to run slower). The ping and trace route results
are displayed in the encapsulated text window. These utilities can be used to verify
network connectivity with the TPS, round trip times for ping, network nodes and hops
between the PC and the TPS address.
You can save the output window to the diagnostic HTML file that you can then email to
the support group.