


Cisco IP Telephony Troubleshooting Guide for Cisco CallManager Release 3.0(1)
© 2000 Cisco Systems, Inc. 15
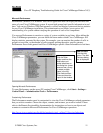
documentation for complete information about turning tracing on and off, and for descriptions of
the User Masks and Levels for each configured service, and more.
http://www.cisco.com/univercd/cc/td/doc/product/voice/c_callmg/3_0/admin_gd/admin_gd/inde
x.htm
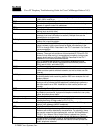
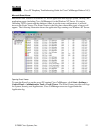
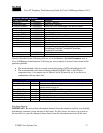
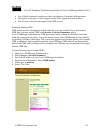
Following are two examples of trace mask bits that would be enabled based on the particular
problem.
• For normal message debugging, turn on subsystem bits 5, 6, 7, 8, 11, and 12
• For debugging gateways, turn on subsystem bits 3,4,5,6,7,8,9,11,12,13
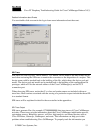
Following are two examples of desired trace levels based on the particular problem
• For normal debugging, the trace level should be set to SDI_LEVEL_ARBITRARY
• For normal running system, the trace level should be set to SDI_LEVEL_ERROR
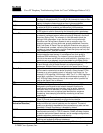
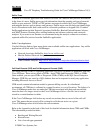
SDL Trace
Cisco engineers use SDL traces to find the cause of an error. You are not expected to understand
the information contained in an SDL trace. However, while working with TAC, you may be
asked to enable the SDL trace and provide it to the TAC. SDL trace files can be saved to local
directories, the Windows NT Event Viewer, and CiscoWorks 2000. To avoid any performance
degradation on the server, be sure that after the trace has been captured, you turn off SDL
tracing.
SDL trace provides a C interface to trace and alarms. Alarms are used to inform the
administrator of unexpected events, such as being unable to access a file, database, Winsock, or
being unable to allocate other operating system resources.
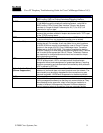
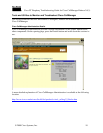
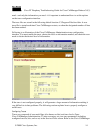
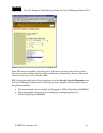
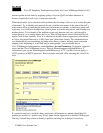
Enabling SDL Trace
SDL traces are enabled in the Service > Service Parameter area in
Cisco CallManager Administration. Remember that these traces should be turned on only when
requested by a TAC engineer. Note the values chosen to turn on the SDL trace in the following
illustration.