


Cisco IP Telephony Troubleshooting Guide for Cisco CallManager Release 3.0(1)
© 2000 Cisco Systems, Inc. 13
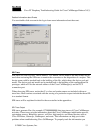
Detailed Information about Events
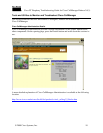
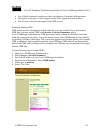
You can double-click an event in the log to learn more information about the event.
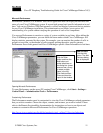
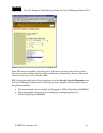
SDI Trace
SDI traces are local log files. The IP address, TCP handle, device name or the time stamp can be
used when reviewing the SDI trace to monitor the occurrence or the disposition of a request. This
device name could be tracked back to the building of the file, which shows the device pool and
model. The device pool and model can be tracked back to the building of the configuration file
prototype, which will list the network address of the Cisco CallManager(s) and the TCP
connection port.
When observing SDI traces, notice that C++ class and routine names are included with most
trace lines. Most routines associated with the serving of a particular request include the thread ID
in a standard format.
SDI traces will be explained in detail in the case studies in the appendices.
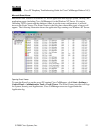
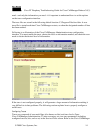
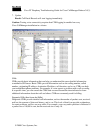
SDI Trace Output
SDI traces generate files (for example, CCM000000000) that store traces of Cisco CallManager
activities. These traces provide information about the Cisco CallManager initialization process,
registration process, KeepAlive process, call flow, digit analysis, and related devices such as
Cisco IP Phones, Gateways, Gatekeepers, and more. This information can help you isolate
problems when troubleshooting Cisco CallManager. To properly track the information you