


UNIT OPERATION > ALTIMETER PAGE
Rino
®
520/530 Owner’s Manual 39
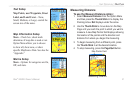
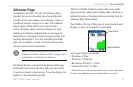
Viewing Pressure/Elevation Plots
When selecting the View Elevation Plot option, you
can plot a profile of elevation changes that occur as you
navigate over a set distance or period of time. When
you select View Pressure Plot, you can view a record of
changes in the ambient or the barometric pressure for a
set period of time. When one option is active the other
displays on the Altimeter Page Option Menu.
To view
elevation or pressure plots:
1. Use the Thumb Stick to highlight the desired
option from the Option Menu and then press In to
display the plot.
2. Adjust time and distance measurement as desired
using the Elevation Plot Zoom Ranges feature
explained below.
3. To clear the plot and start a new one, you must
clear the Track Log.
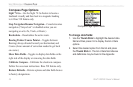
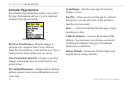
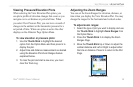
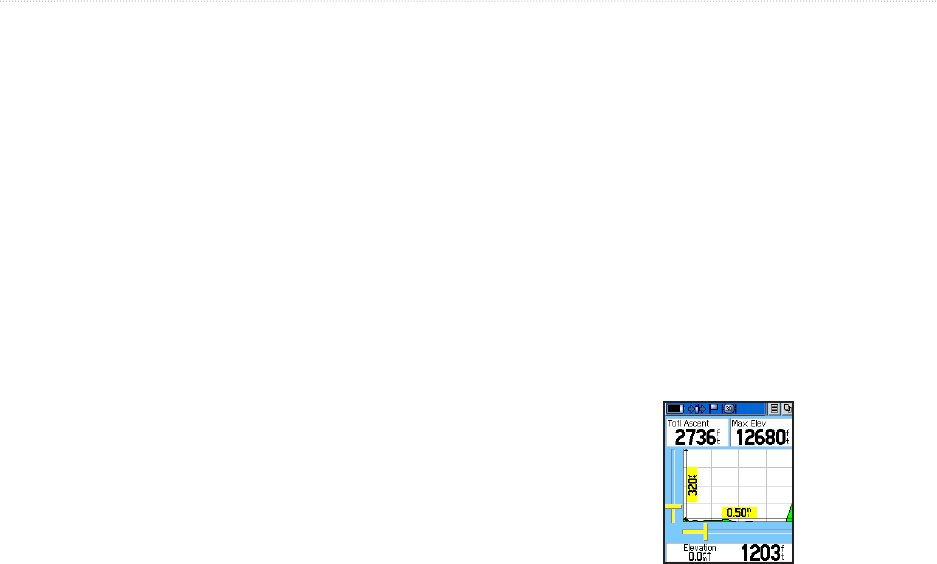
Adjusting the Zoom Ranges
You can set the Zoom Ranges for elevation, distance, or
time when you display the View Elevation Plot. You may
change the ranges for the horizontal and vertical scales.
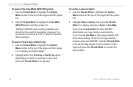
To adjust zoom ranges:
1. Select the type of plot you want to display and use
the Thumb Stick to highlight Zoom Ranges from
the Option Menu.
2. Press the Thumb Stick In to display the Zoom
Ranges Page.
3. Move the Thumb Stick Up or Down to adjust the
vertical distance and Left or Right to adjust either
the time or distance. Press In to return to the Plot
Page.
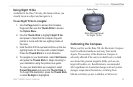
Zoom Range selection